
This report is part of our cross-asset “What Matters” publication, a new, differentiated product available via a separate subscription. To access the full analysis, please upgrade below or contact us at info@10xresearch.com with any questions.
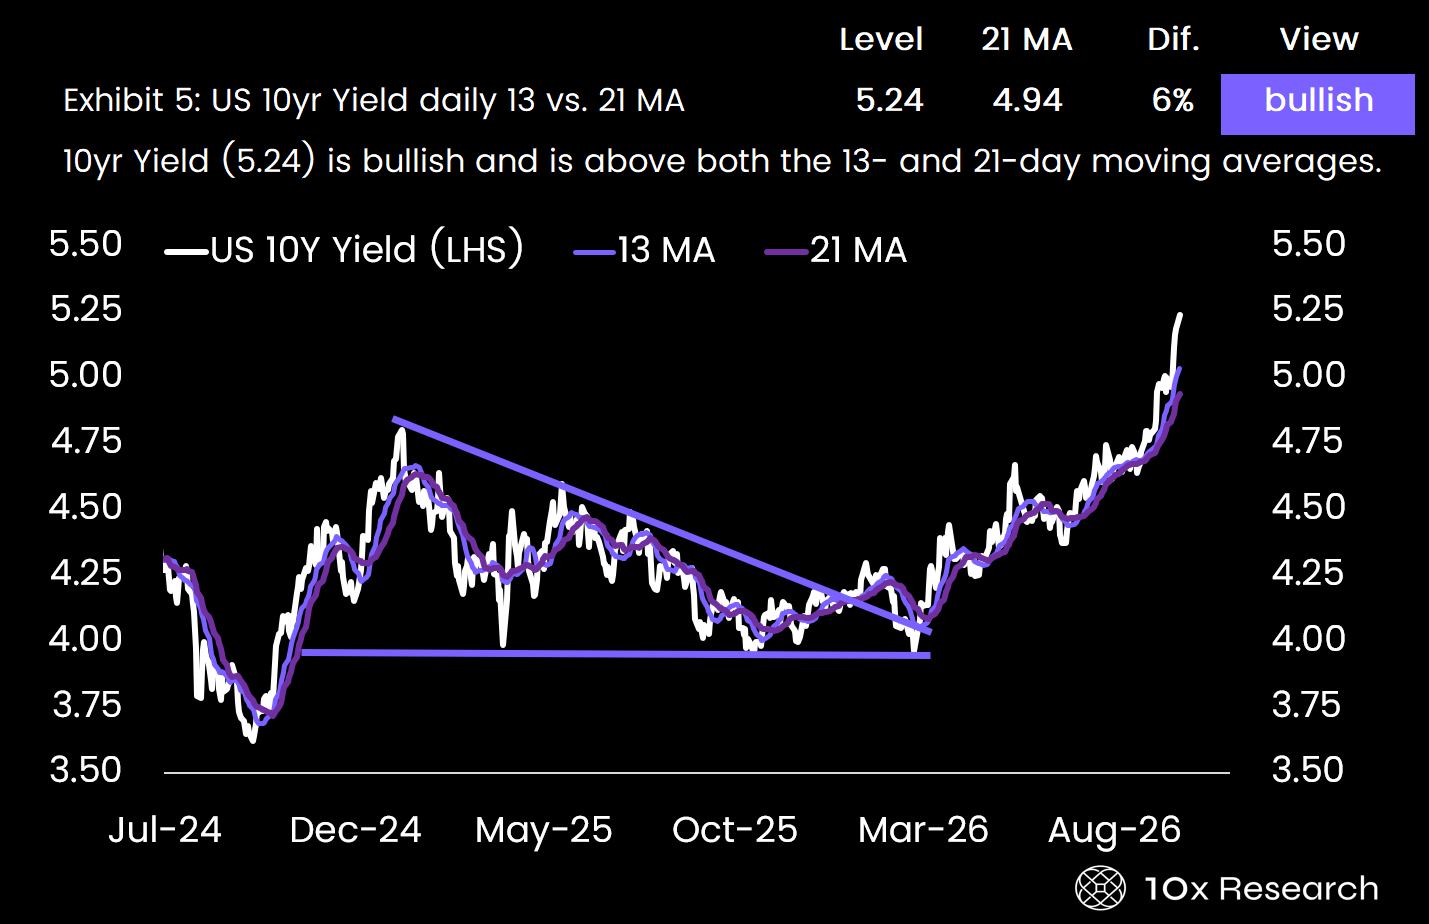
The 10-year Treasury yield has just moved into territory it hasn’t reached in this cycle. The question for every asset class, from bonds to equities to crypto, is whether this is a new regime or a move that has run too far. Our latest Chart Book works through 30 exhibits across the daily, weekly, and monthly timeframes.
It shows which signals carry the most weight, where the trend and the exhaustion signals disagree, and the level that will decide what comes next. It also includes our full support map for all three timeframes.
Please find attached our 12-page report with the most important charts.